Exploring User-Definable Graph Layouts
a graph in a graph. a graphception.
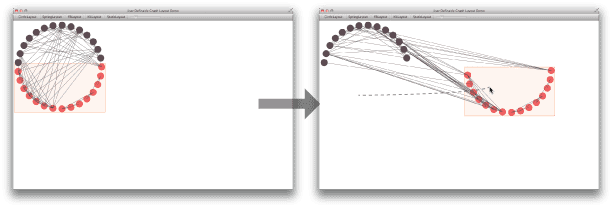
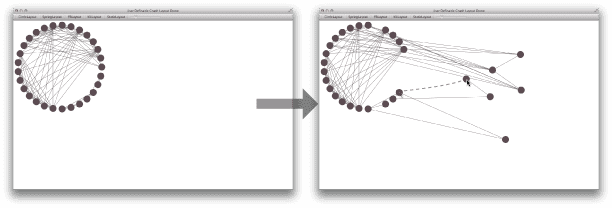
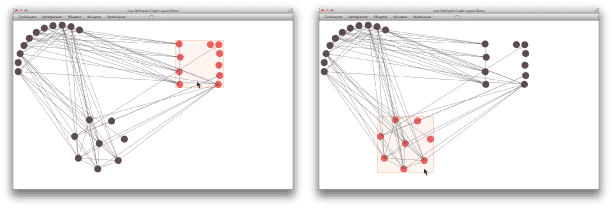
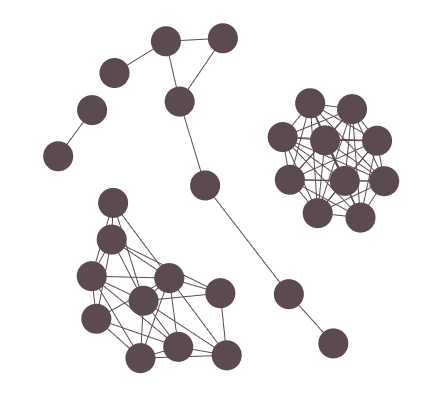
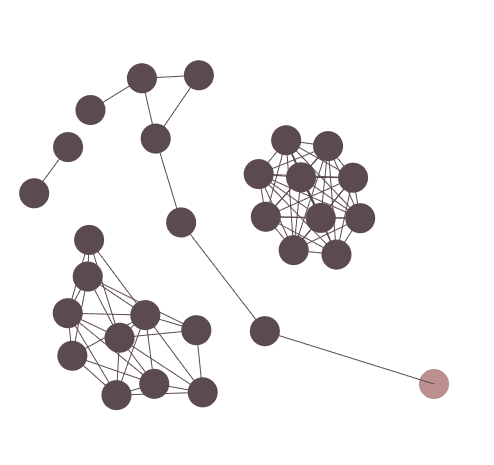
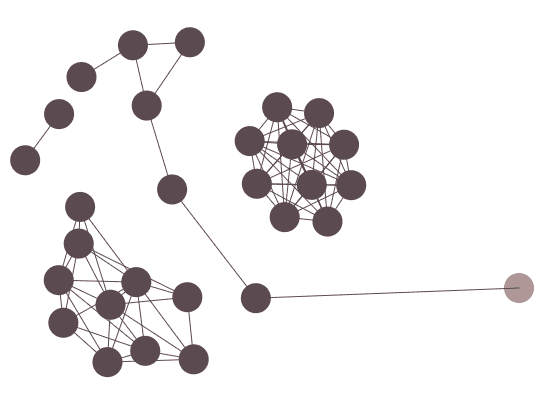
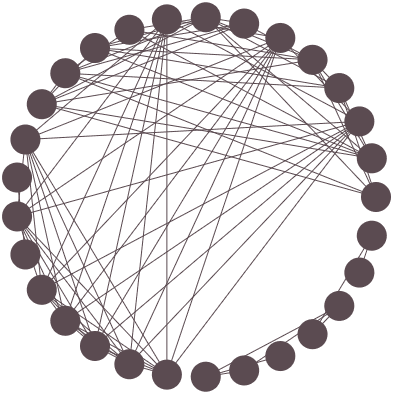
Graphs are a common type of data encountered by analysts. Social networks, co-author networks, and gene interactions can all be represented as graphs. These types of data can be difficult to understand without the aid of a visualization. Visual analytics tools with graph visualizations allows the analysts to view data as a node link diagram. Vertices or nodes represent objects. Edges represent the relationship between two nodes. To render graphs, a number of automatic graph layouts have been developed. These algorithms use properties of the graph, like the number of interconnections between nodes, to compute positions for the graph’s vertices. While these algorithms have a number of parameters that can be adjusted to affect the layout, they are automatic - no analyst input is used to position the graph nodes.
I wrote a paper that discusses how automated graph layouts do not meet the needs of analysts and propose an interaction technique to better meet the needs of the analyst. I also built a prototype that helps with analysts with the sense-making process.
Responsibilities
- Exploring different graph layouts that can help analysts with the sense-making process
- Built the prototype using javafx
- Write a paper report about the research
Take-Away
- Able to do research and look for different approaches to solve a problem
- Able to learn a new language and use it to build a prototype in a short period of time


Technologies
- Java
- JavaFX
- Jung: Java Graph Framework